Louisiana Economy Forecasting Model
As a service to the State of Louisiana, the LSU Department of Economics provides economic forecasts for the state and the 10 metropolitan areas of the state for the current quarter and three quarters ahead.
About the Forecasting Model
At the state level, forecasts are generated for four key economic variables: real Gross State Product (a measure of the real value of goods and services produced within Louisiana, analogous to national real GDP), total non-farm employment, the total unemployment rate, and the Louisiana house price index. At the metro level, due to data limitations, only total non-farm employment is forecast.
The forecasting model consists of a suite of statistical models. The statistical models used are the ones that yielded the best out-of-sample forecasts over a long period of time. The specification procedure replicates what a forecaster would do in real-time to generate out-of-sample forecasts, i.e., estimate a model using data up to the point of the forecast and then forecast out-of-sample.
Use the "Learn More" button below to read a full breakdown of the model's construction. For more information regarding how to read the forecasts, consult the dropdowns under the "Additional Information" section at the bottom of this page.
Current Louisiana Forecasts
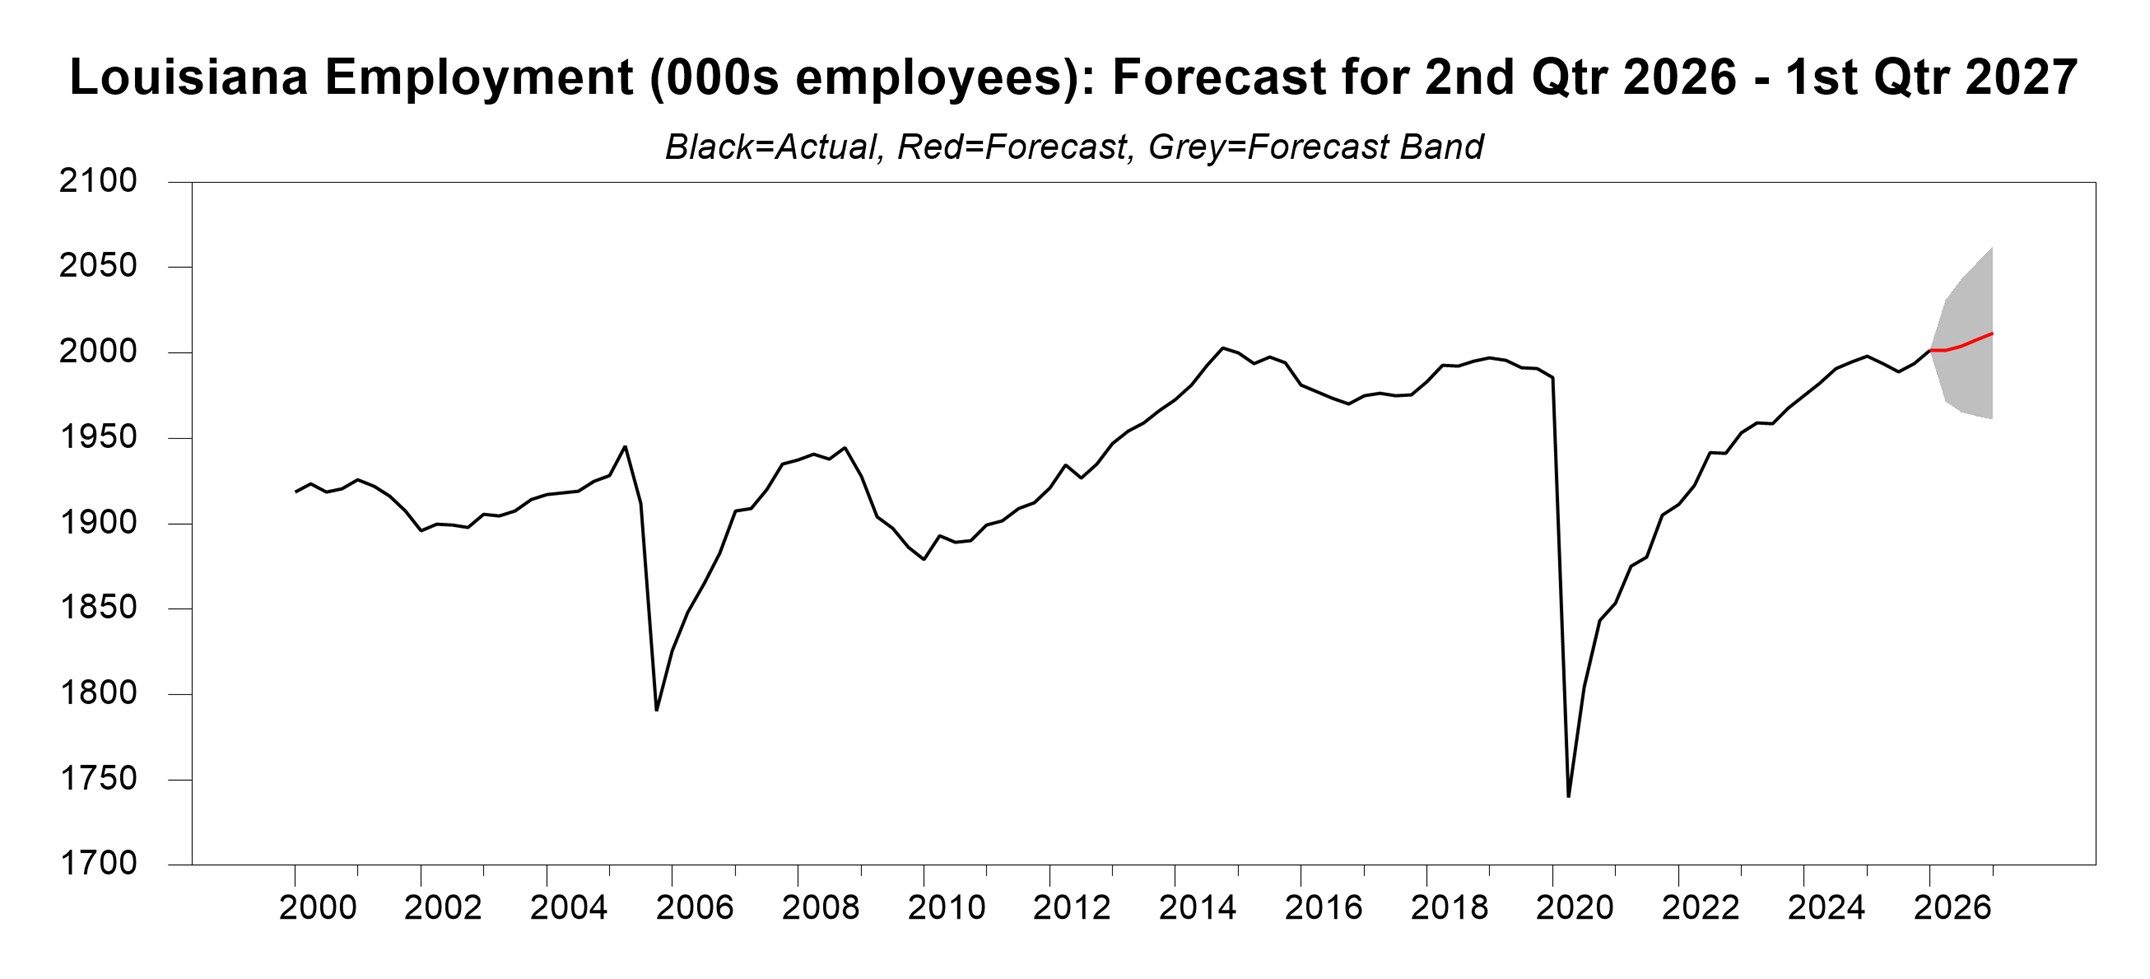
Forecast for Louisiana Non-Farm Employment (Thousands of Employees)
| Quarter | Lower Bound | Forecast | Upper Bound |
| 2026:02 | 1971.72 | 2001.42 | 2031.12 |
| 2026:03 | 1965.20 | 2004.16 | 2043.12 |
| 2026:04 | 1962.89 | 2007.67 | 2052.45 |
| 2027:01 | 1960.95 | 2011.81 | 2062.67 |
After dipping a bit in the second quarter from its first quarter level, employment is forecast to rise steadily over the rest of the forecast horizon. But, from the first quarter of 2026 to the first quarter of 2027, employment is forecast to rise only 0.5%.
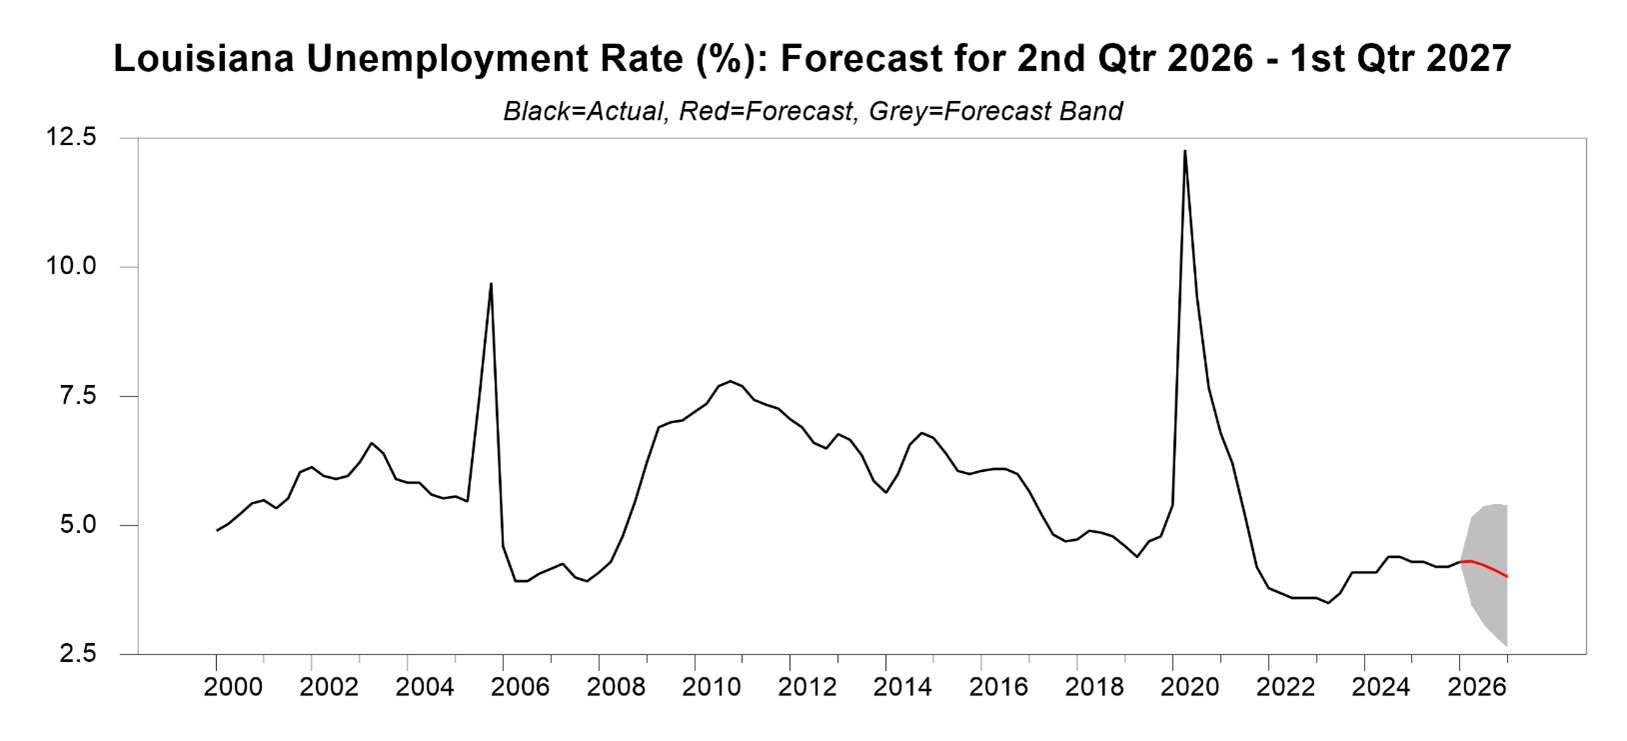
Forecast for Louisiana Unemployment Rate (%)
| Quarter | Lower Bound | Forecast | Upper Bound |
| 2026:02 | 3.5 | 4.3 | 5.2 |
| 2026:03 | 3.1 | 4.2 | 5.4 |
| 2026:04 | 2.8 | 4.1 | 5.4 |
| 2027:01 | 2.6 | 4.0 | 5.4 |
The Louisiana unemployment rate is forecast to hold steady in the second quarter at the first quarter value and then slowly fall to 4% in the first quarter of 2027.
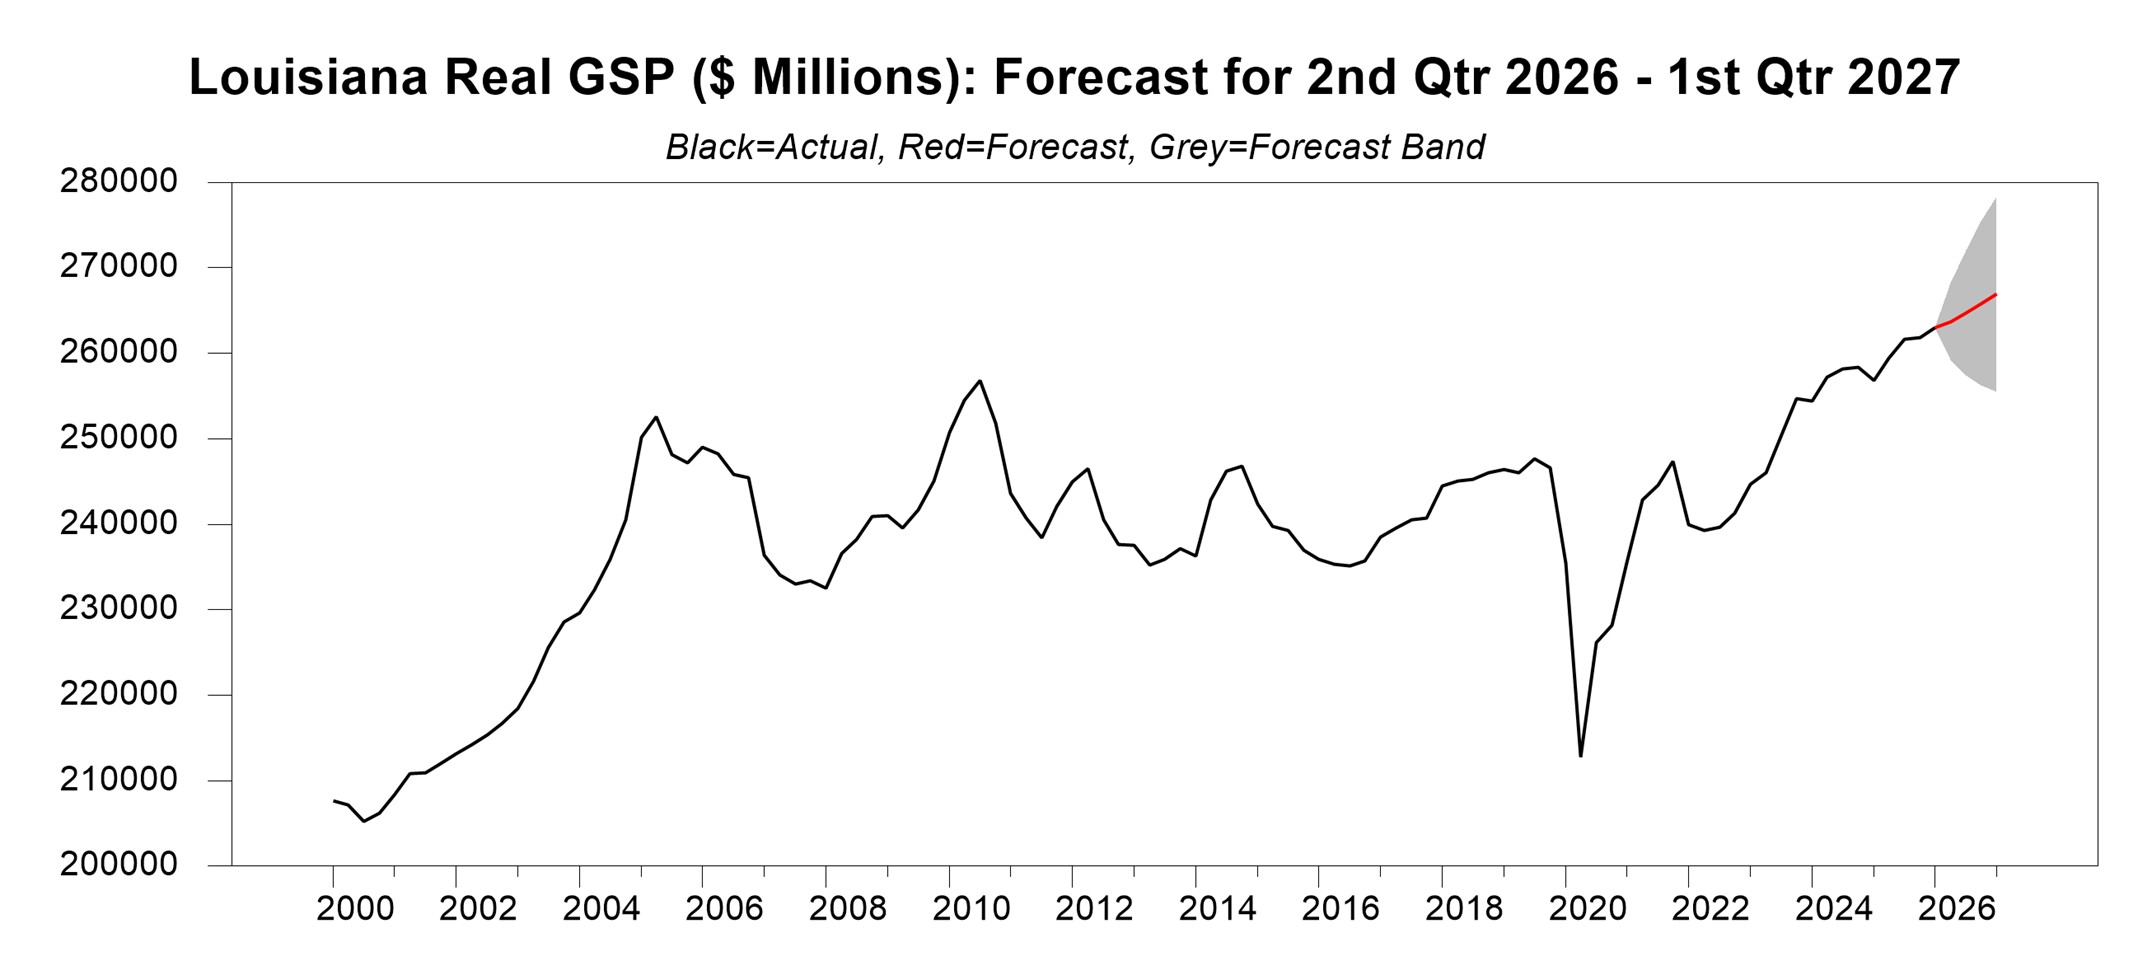
Forecast for Louisiana Real GSP (Millions of $)
| Quarter | Lower Bound | Forecast | Upper Bound |
| 2026:02 | 259234.85 | 263717.68 | 268200.51 |
| 2026:03 | 257441.51 | 264742.73 | 272043.96 |
| 2026:04 | 256239.54 | 265822.43 | 275405.32 |
| 2027:01 | 255484.79 | 266930.52 | 278376.25 |
Real GSP is forecast to rise steadily over the next 4 quarters. The growth rate from the first quarter of 2026 to the first quarter of 2027 is forecast to be 1.5%.
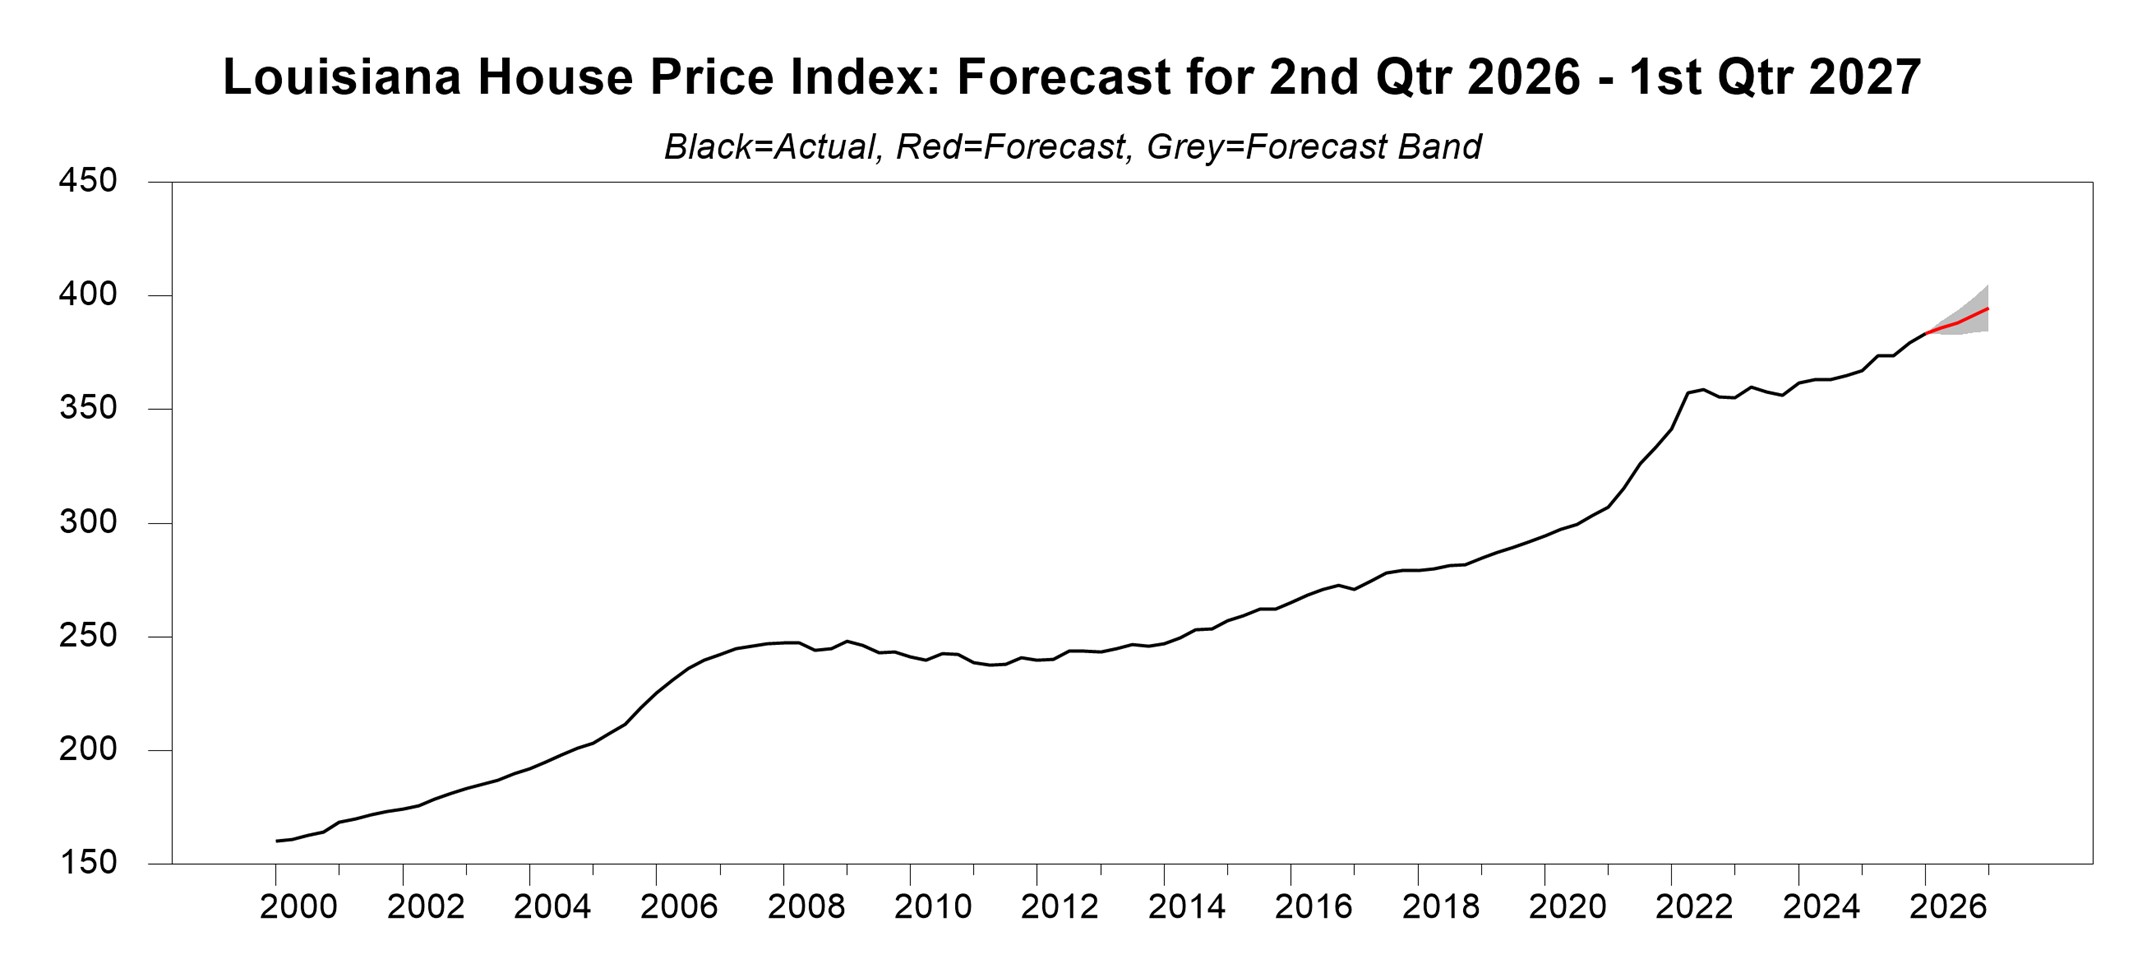
Forecast for Louisiana House Price Index
| Quarter | Lower Bound | Forecast | Upper Bound |
| 2026:02 | 383.04 | 385.98 | 388.91 |
| 2026:03 | 382.55 | 388.04 | 393.53 |
| 2026:04 | 383.73 | 391.36 | 398.99 |
| 2027:01 | 384.36 | 394.64 | 404.93 |
Louisiana house prices are forecast to rise each quarter over the next year. The rate of growth from the first quarter of 2026 to the first quarter of 2027 is forecast to be 2.9%.
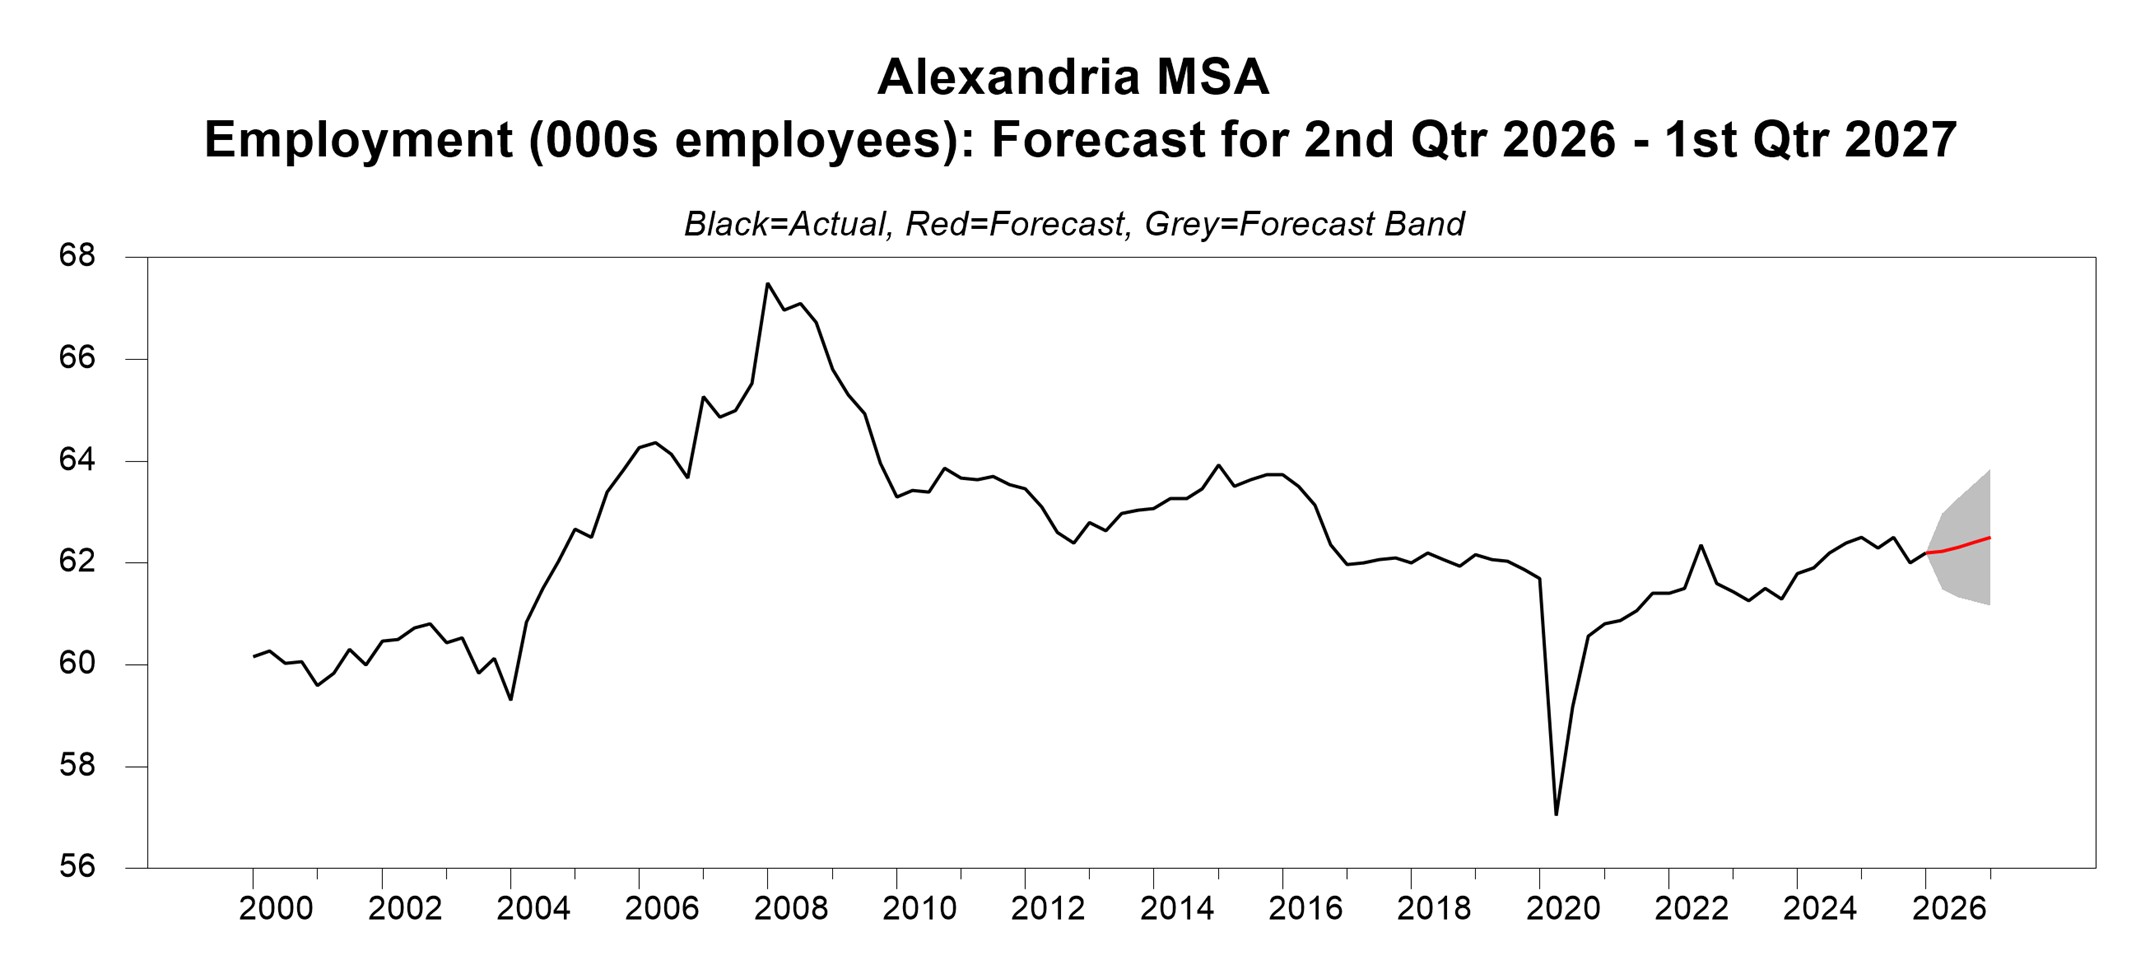
Forecast for Alexandria Metro Area Non-Farm Employment (Thousands of Employees)
| Quarter | Lower Bound | Forecast | Upper Bound |
| 2026:02 | 61.49 | 62.23 | 62.97 |
| 2026:03 | 61.33 | 62.31 | 63.29 |
| 2026:04 | 61.24 | 62.40 | 63.56 |
| 2027:01 | 61.17 | 62.50 | 63.84 |
Employment in the Alexandria metro area is forecast to inch up in each quarter, rising slowly at a rate of 0.5% over the current forecast horizon.
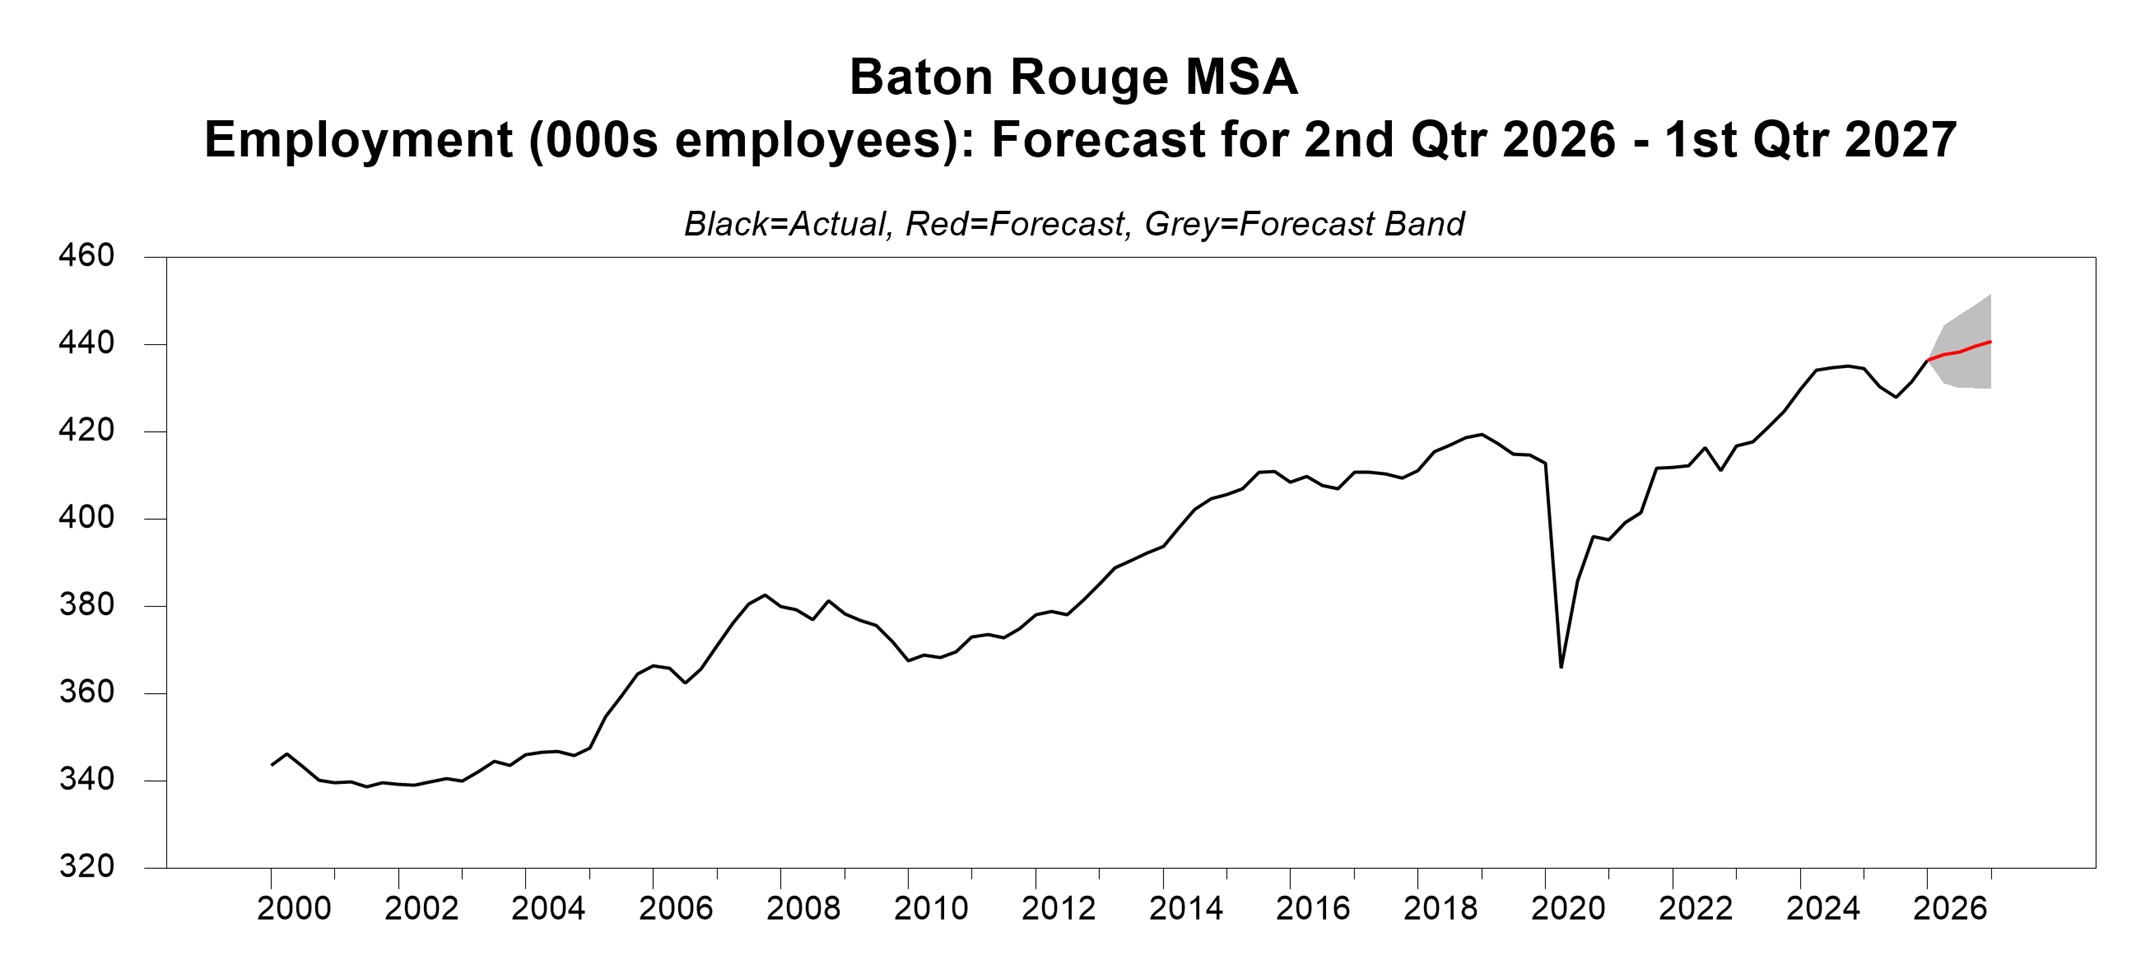
Forecast for Baton Rouge Metro Area Non-Farm Employment (Thousands of Employees)
| Quarter | Lower Bound | Forecast | Upper Bound |
| 2026:02 | 431.23 | 437.85 | 444.47 |
| 2026:03 | 429.99 | 438.45 | 446.91 |
| 2026:04 | 430.10 | 439.63 | 449.16 |
| 2027:01 | 429.88 | 440.78 | 451.67 |
Employment in the Baton Rouge metro area is forecast to rise in each quarter of the forecast horizon with a forecast rate of growth in employment from the first quarter of 2026 to the first quarter of 2027 of 1%.
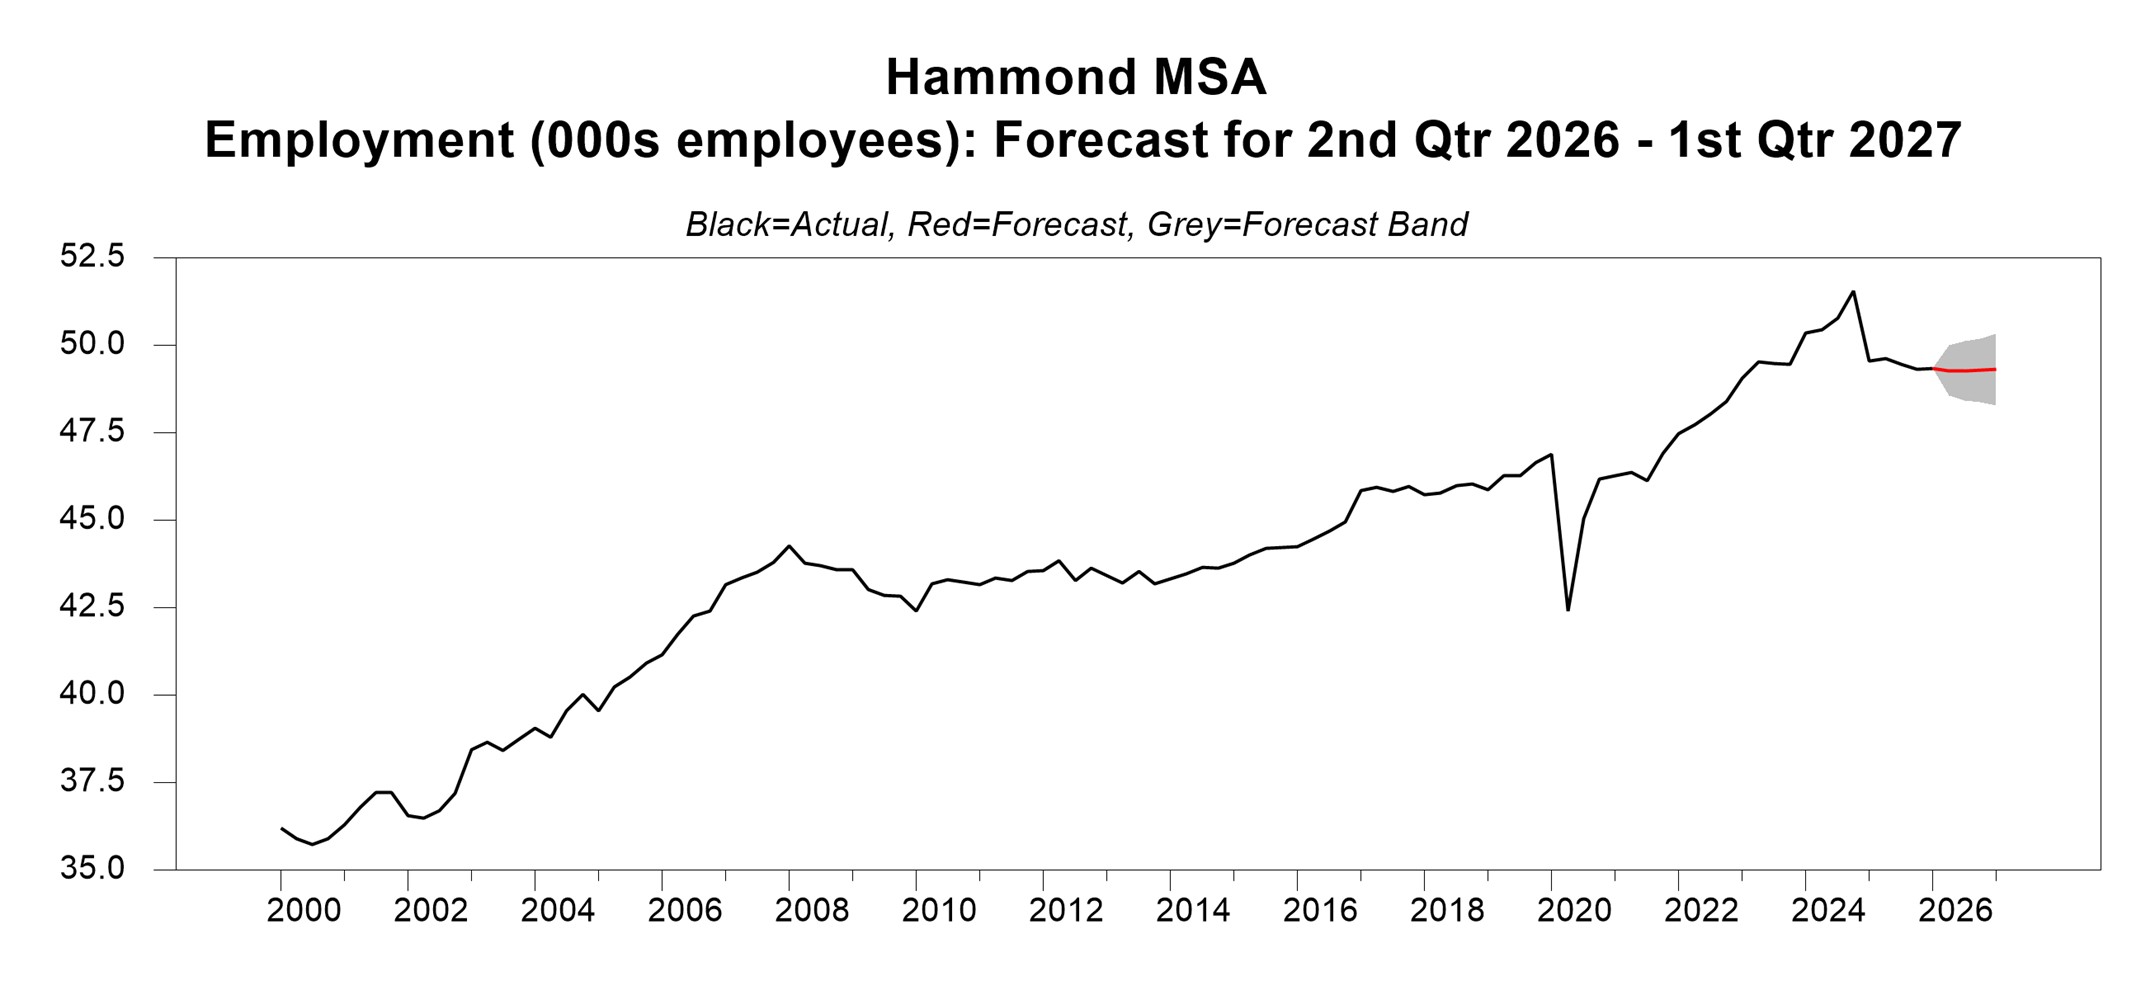
Forecast for Hammond Metro Area Non-Farm Employment (Thousands of Employees)
| Quarter | Lower Bound | Forecast | Upper Bound |
| 2026:02 | 48.56 | 49.28 | 50.00 |
| 2026:03 | 48.43 | 49.28 | 50.13 |
| 2026:04 | 48.38 | 49.29 | 50.20 |
| 2027:01 | 48.28 | 49.31 | 50.34 |
Stagnant employment for the Hammond metro area is forecast for the next 4 quarters, falling at a rate of 0.1% from the first quarter of 2026 to the first quarter of 2027. Although employment in each quarter is forecast to be below the first quarter value, employment in the last two quarters of the forecast horizon is forecast to be above that in the first two quarters of the forecast horizon.
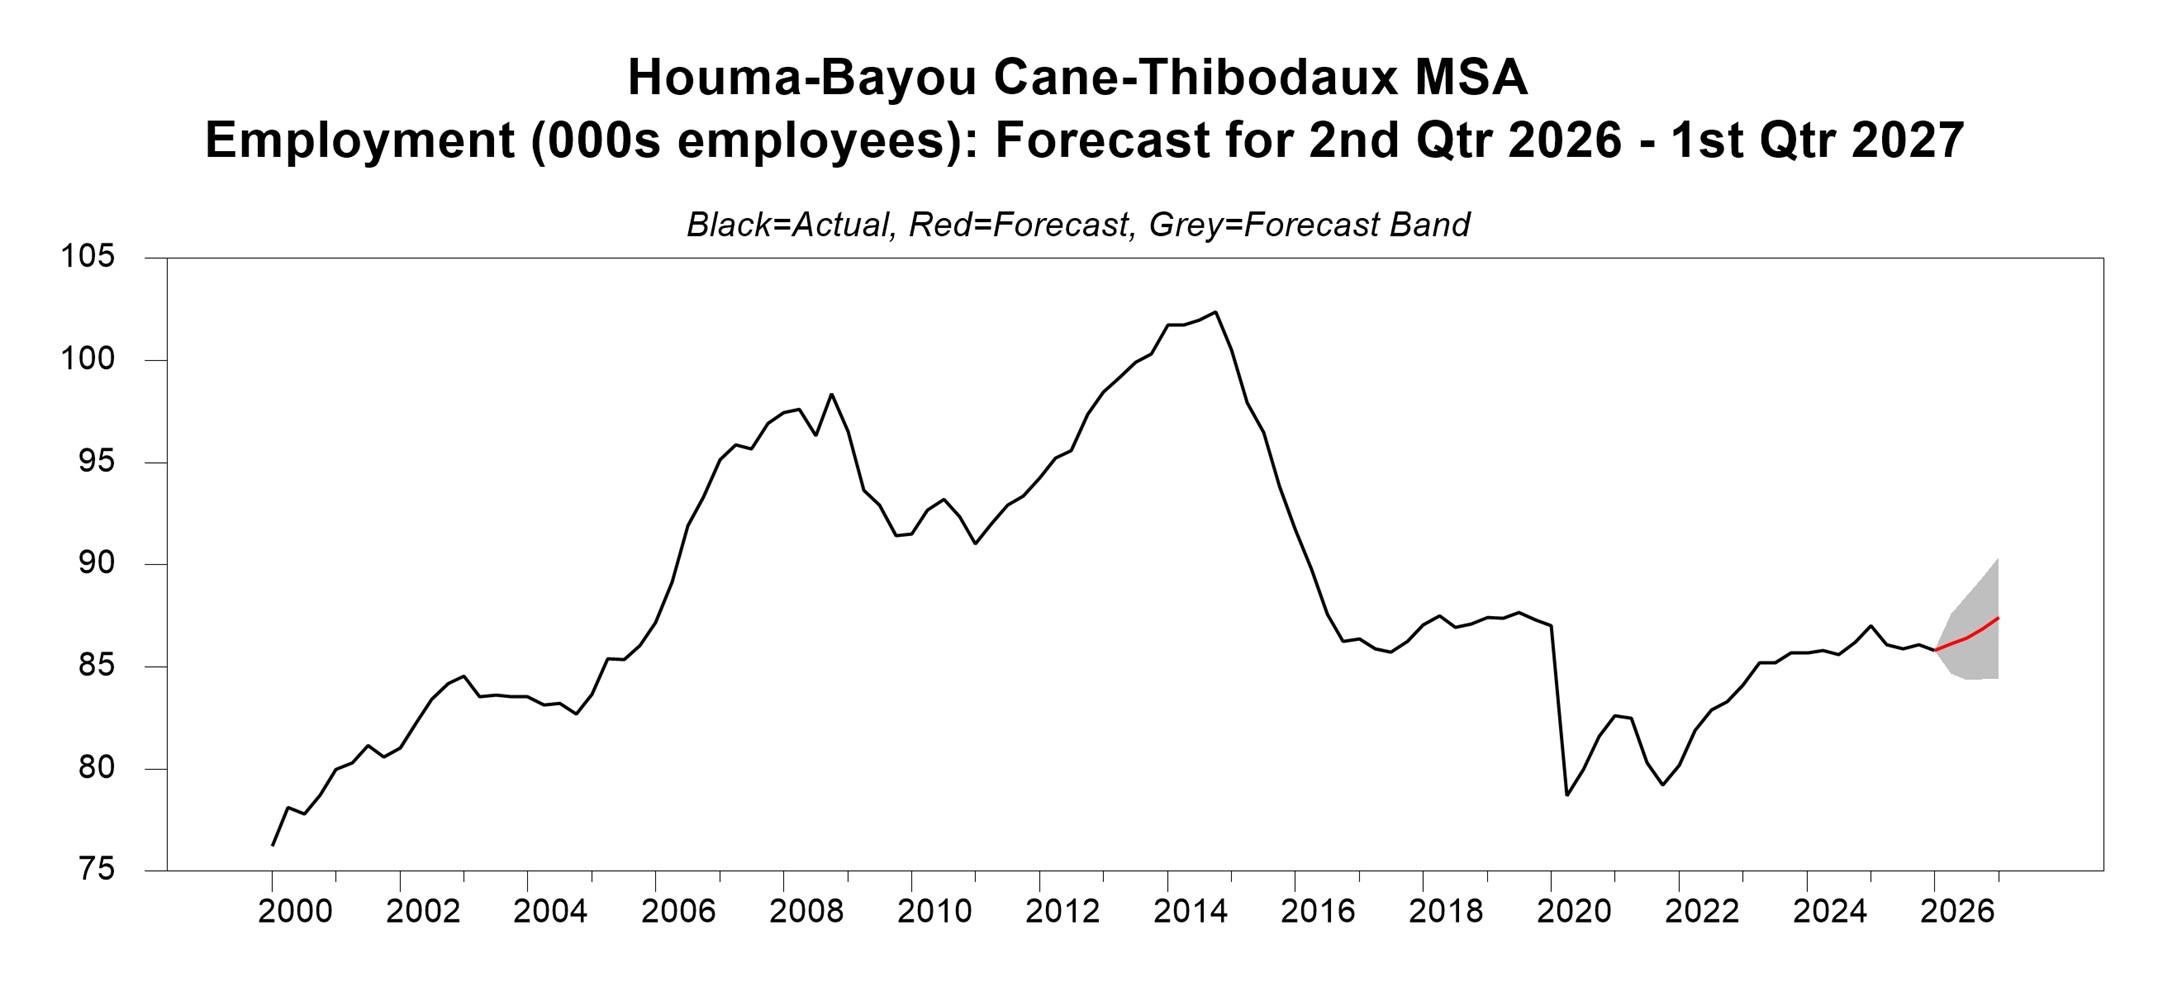
Forecast for Houma-Bayou Cane-Thibodaux Metro Area Non-Farm Employment (Thousands of Employees)
| Quarter | Lower Bound | Forecast | Upper Bound |
| 2026:02 | 84.65 | 86.11 | 87.57 |
| 2026:03 | 84.34 | 86.41 | 88.49 |
| 2026:04 | 84.38 | 86.87 | 89.36 |
| 2027:01 | 84.44 | 87.42 | 90.39 |
Employment in the Houma-Bayou Cane-Thibodaux metro area is forecast to rise steadily over the forecast horizon. The rate of growth from the first quarter of 2026 to the first quarter of 2027 is forecast to be 1.9%, the second fastest of the state’s metro areas.
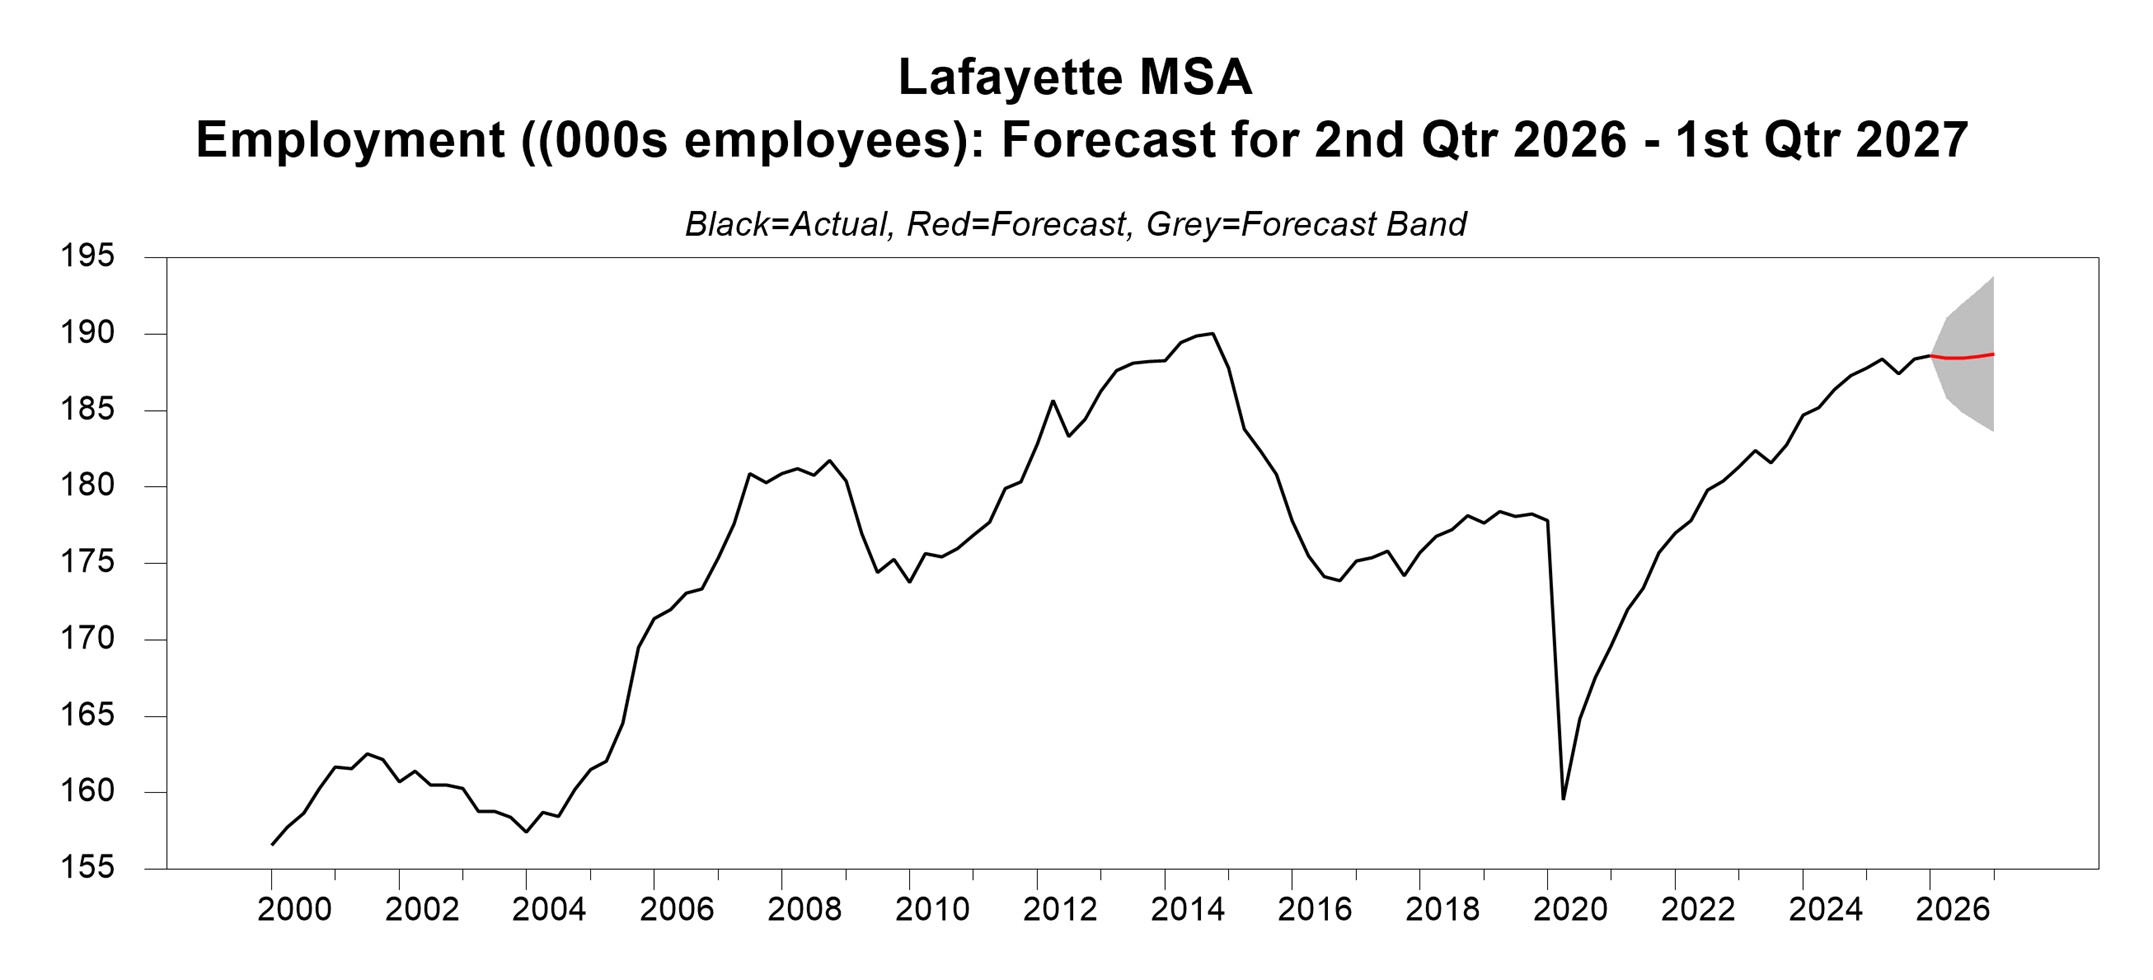
Forecast for Lafayette Metro Area Non-Farm Employment (Thousands of Employees)
| Quarter | Lower Bound | Forecast | Upper Bound |
| 2026:02 | 185.80 | 188.43 | 191.07 |
| 2026:03 | 184.89 | 188.44 | 192.00 |
| 2026:04 | 184.26 | 188.55 | 192.84 |
| 2027:01 | 183.58 | 188.72 | 193.85 |
Employment for the Lafayette metro area is forecast to rise by a small amount over the forecast horizon with employment in the first quarter of 2027 forecast to be 0.1% greater than in the first quarter of 2026.
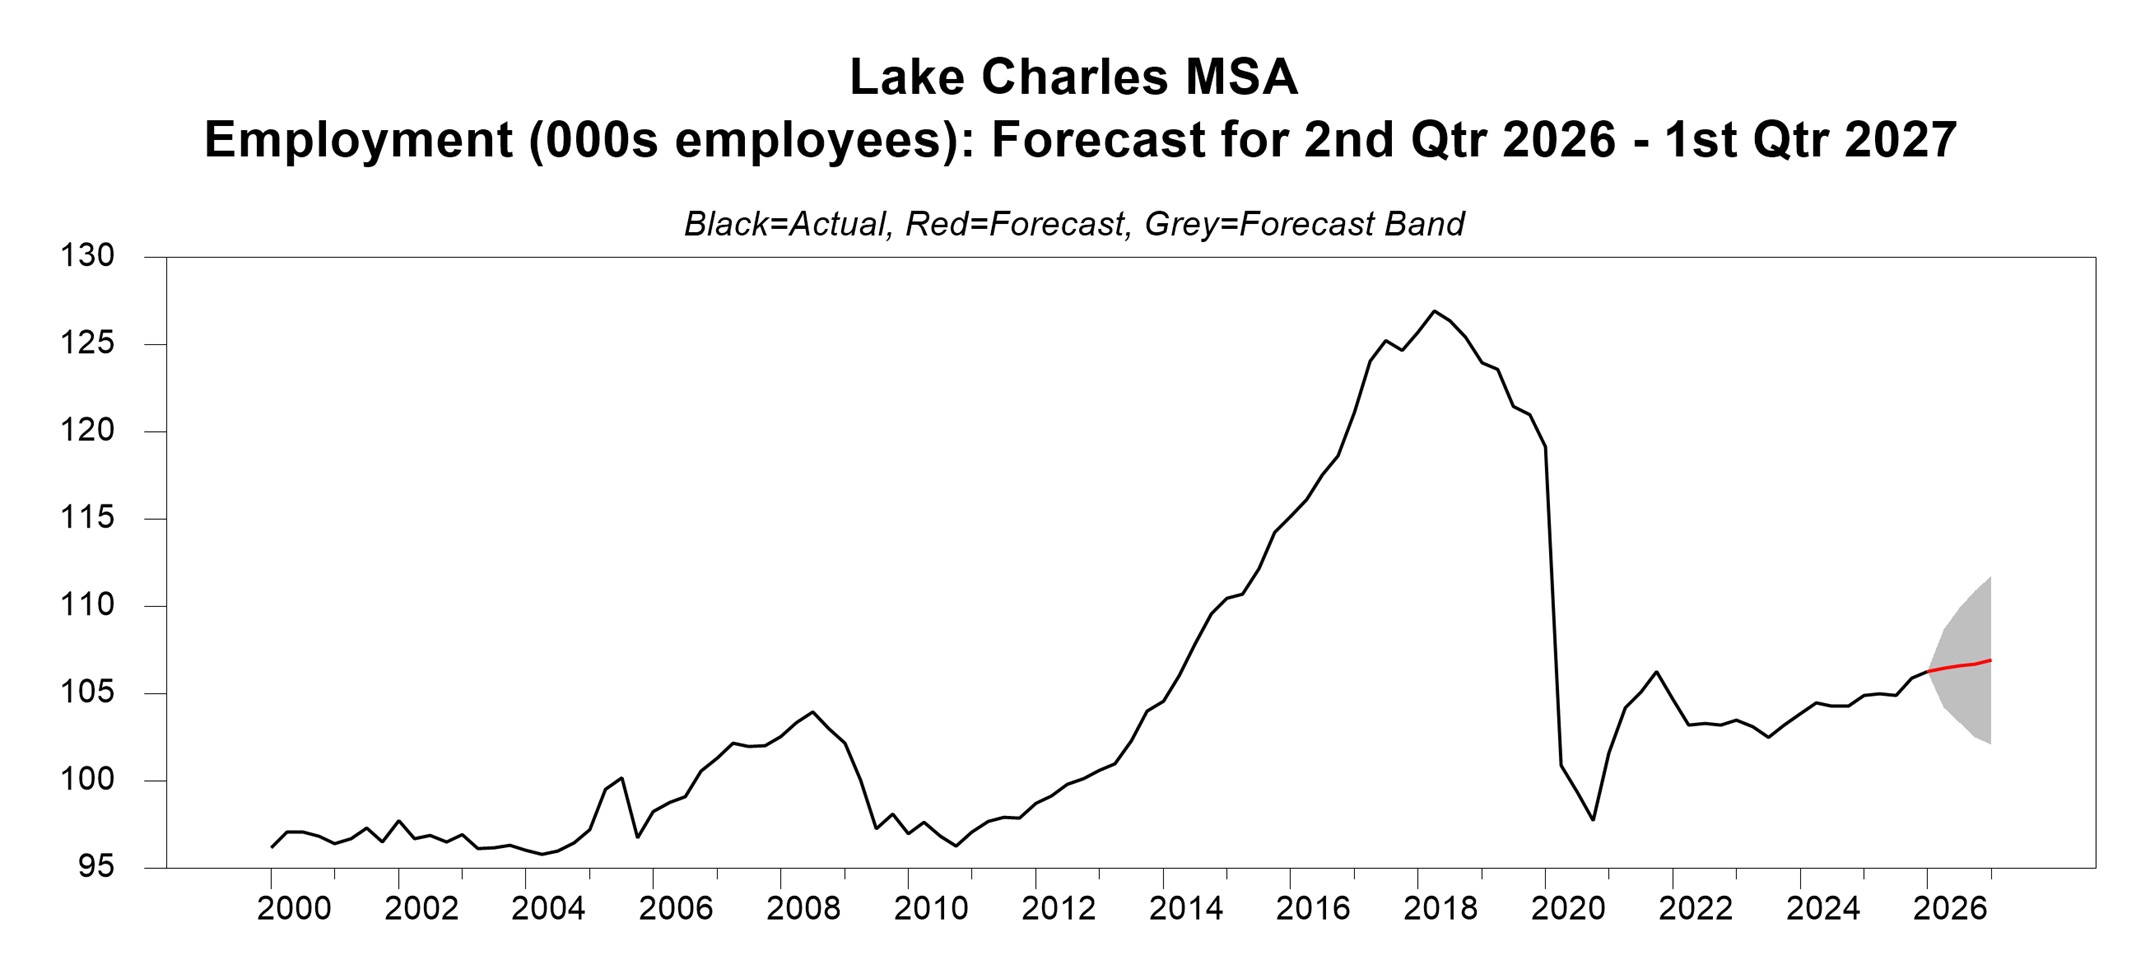
Forecast for Lake Charles Metro Area Non-Farm Employment (Thousands of Employees)
| Quarter | Lower Bound | Forecast | Upper Bound |
| 2026:02 | 104.21 | 106.46 | 108.70 |
| 2026:03 | 103.34 | 106.63 | 109.93 |
| 2026:04 | 102.52 | 106.72 | 110.93 |
| 2027:01 | 102.10 | 106.92 | 111.75 |
Employment in the Lake Charles metro area is forecast to rise by a small amount in each quarter of the forecast horizon, increasing 0.6% from the first quarter of 2026 to the first quarter of 2027.
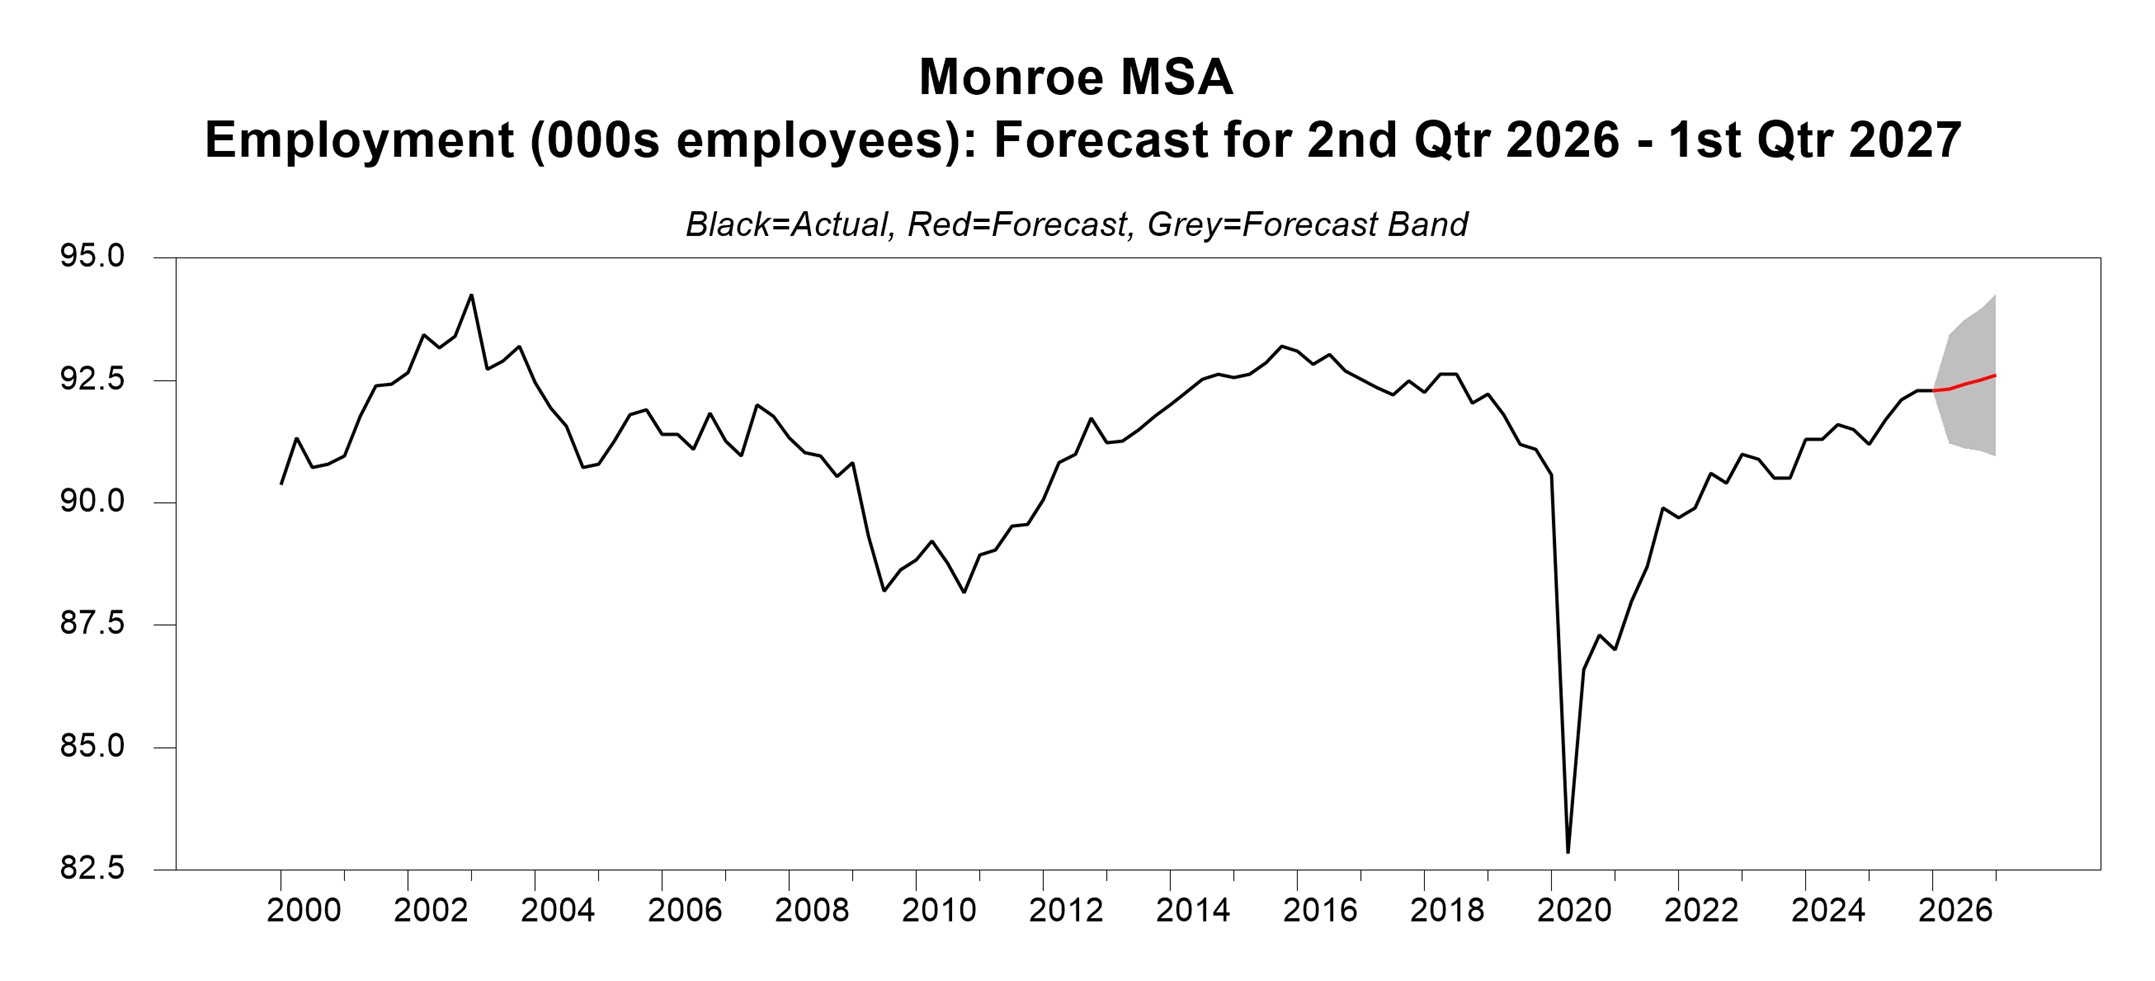
Forecast for Monroe Metro Area Non-Farm Employment (Thousands of Employees)
| Quarter | Lower Bound | Forecast | Upper Bound |
| 2026:02 | 91.22 | 92.32 | 93.42 |
| 2026:03 | 91.10 | 92.43 | 93.75 |
| 2026:04 | 91.06 | 92.51 | 93.96 |
| 2027:01 | 90.95 | 92.61 | 94.27 |
Employment in the Monroe metro area is forecast to rise by a small amount in each quarter of the forecast horizon, rising by only 0.3% from the first quarter of 2026 to the first quarter of 2027. Given the large-scale construction currently proceeding in this metro area and the fact that the time series forecasting model relies heavily upon lags in employment in the metro area in generating forecasts, there is likely more than normal uncertainly in the employment forecasts for this MSA.
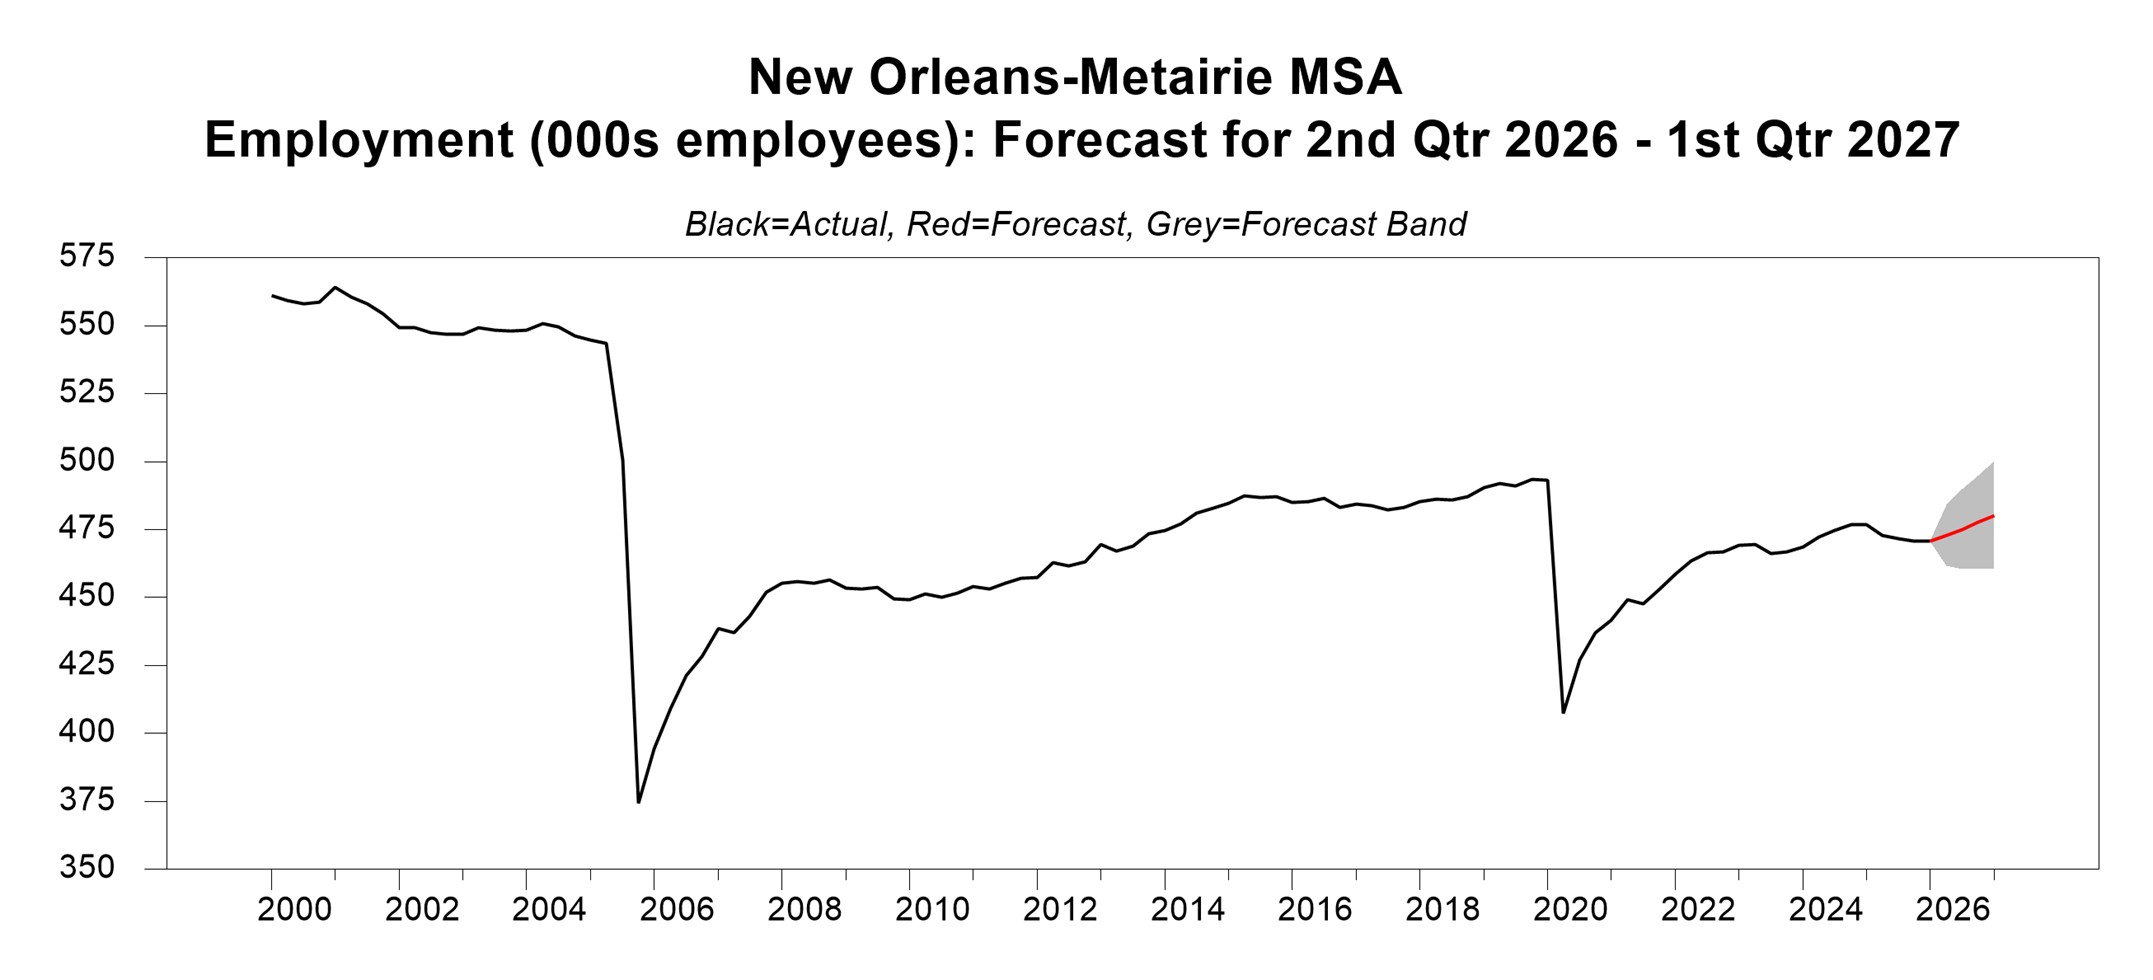
Forecast for New Orleans-Metairie Metro Area Non-Farm Employment (Thousands of Employees)
| Quarter | Lower Bound | Forecast | Upper Bound |
| 2026:02 | 461.57 | 472.79 | 484.01 |
| 2026:03 | 460.44 | 475.14 | 489.85 |
| 2026:04 | 460.50 | 477.67 | 494.83 |
| 2027:01 | 460.47 | 480.26 | 500.04 |
Employment in the New Orleans-Metairie metro area is forecast to continue to rebound from the pandemic low and the dip in employment in 2025. The forecast growth rate from the first quarter of 2026 to the first quarter of 2027 is 2%, the strongest of any of the state’s metro areas.
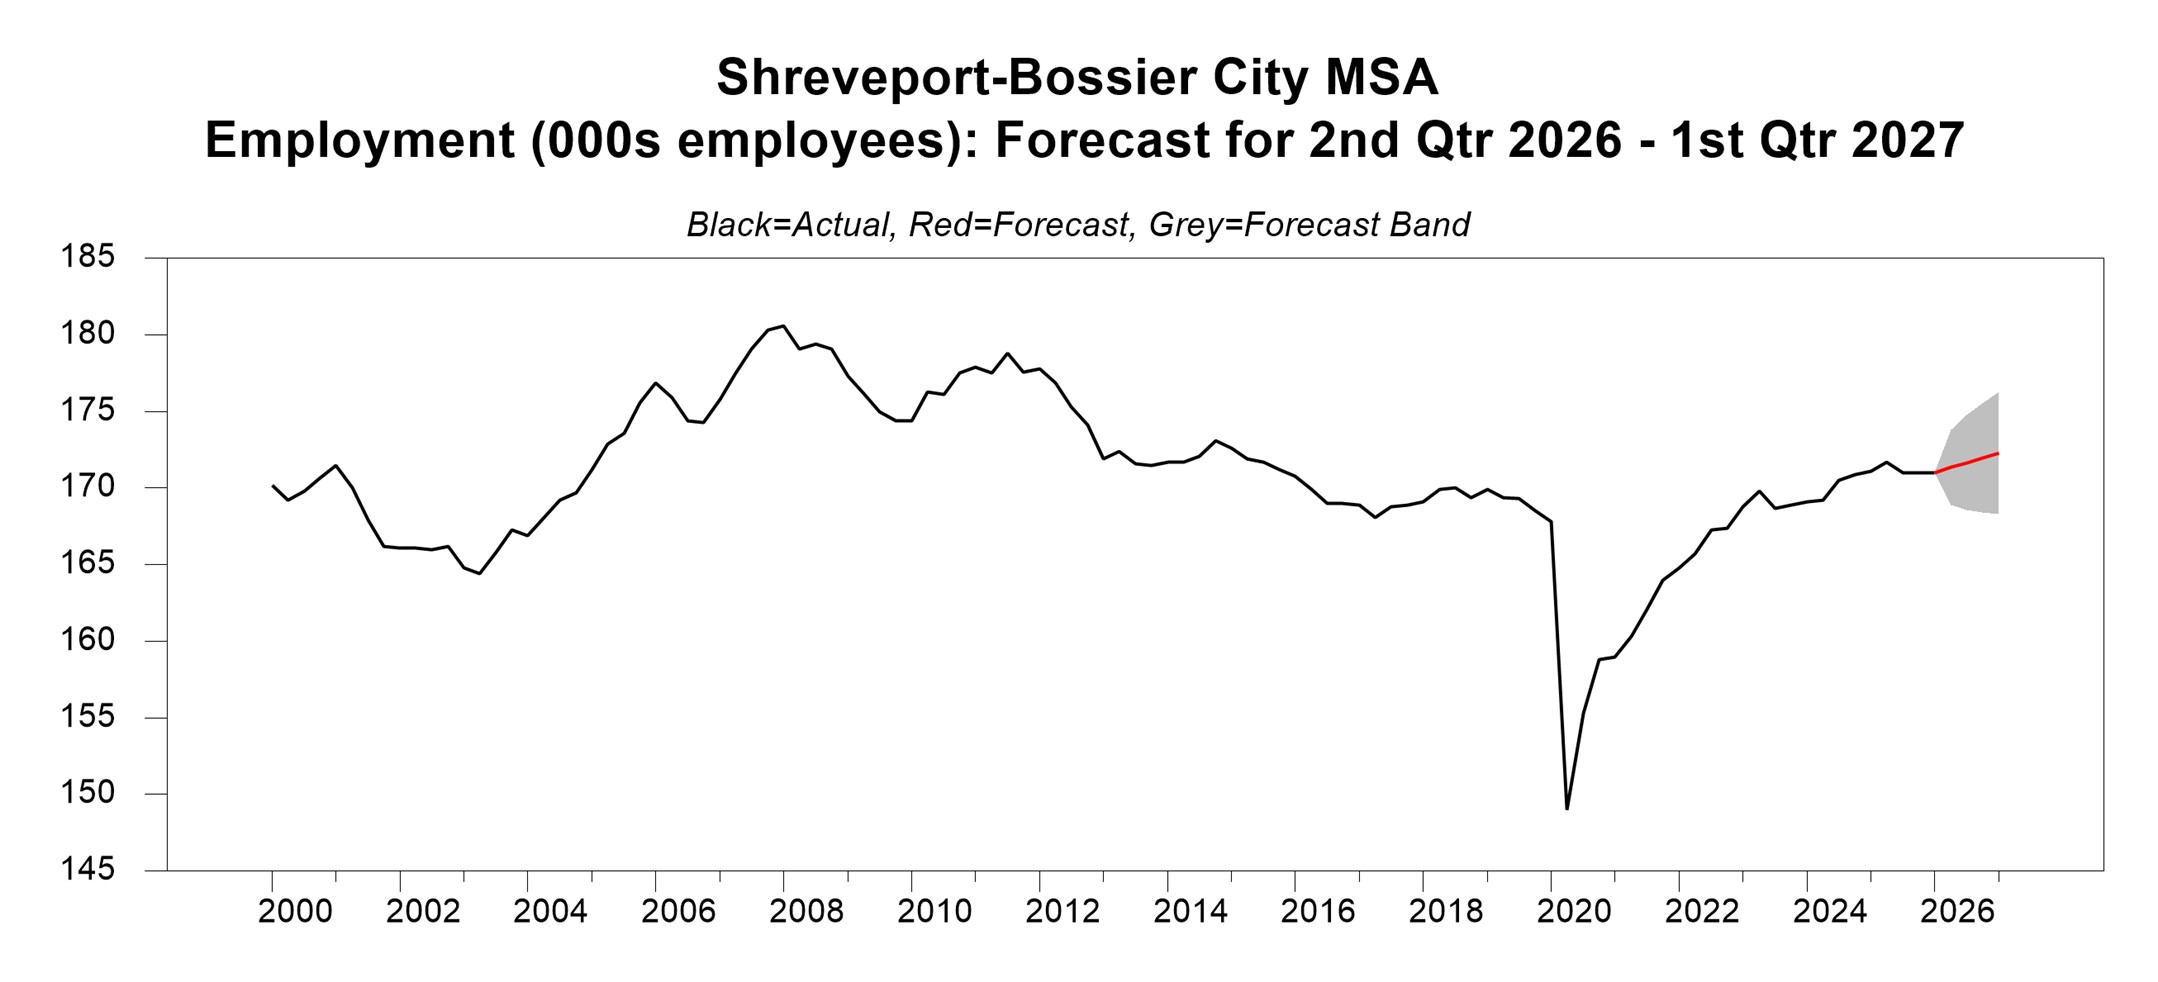
Forecast for Shreveport-Bossier City Metro Area Non-Farm Employment (Thousands of Employees)
| Quarter | Lower Bound | Forecast | Upper Bound |
| 2026:02 | 168.90 | 171.35 | 173.81 |
| 2026:03 | 168.55 | 171.67 | 174.79 |
| 2026:04 | 168.43 | 171.98 | 175.53 |
| 2027:01 | 168.32 | 172.30 | 176.27 |
Employment for the Shreveport-Bossier City metro area is forecast to rise slowly but steadily over the forecast horizon. The growth rate of employment from the first quarter of 2026 to the first quarter of 2027 is forecast to be 0.8%.
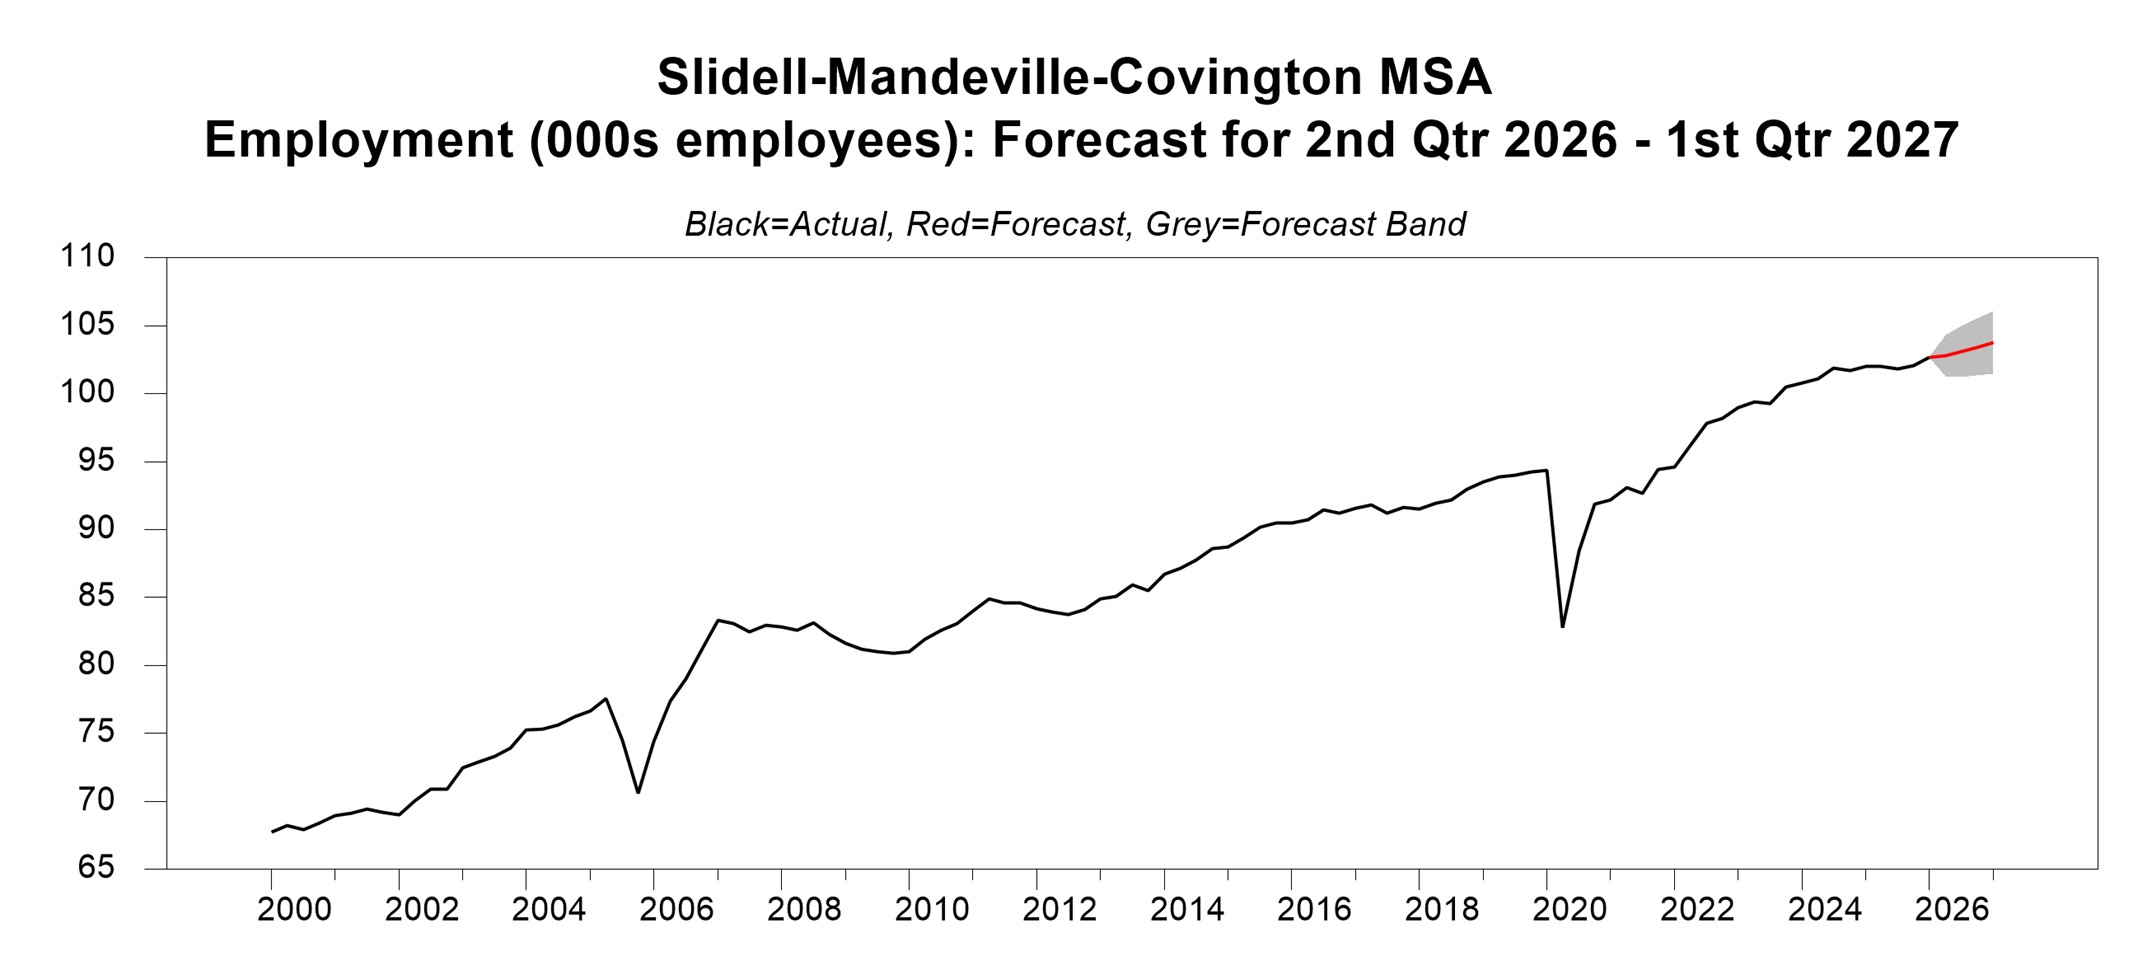
Forecast for Slidell-Mandeville-Covington Metro Area Non-Farm Employment (Thousands of Employees)
| Quarter | Lower Bound | Forecast | Upper Bound |
| 2026:02 | 101.27 | 102.79 | 104.30 |
| 2026:03 | 101.23 | 103.10 | 104.96 |
| 2026:04 | 101.33 | 103.42 | 105.51 |
| 2027:01 | 101.45 | 103.77 | 106.08 |
Employment in the Slidell-Mandeville-Covington MSA is forecast to rise steadily over the forecast horizon. The growth rate from the first quarter of 2026 to the first quarter of 2027 is forecast to be 1%, the third fastest growth of the state’s metro areas.
Additional Information
Two of the statistical models—a state-level model and a national model—are Bayesian Vector Autoregressive Models (BVARs) and the remaining models are single-equation autoregressive models.
Economists have used BVAR models to forecast state and national economic variables. Typically, these models have been found to forecast out-of-sample better than standard Vector Autoregressive (VAR) Models and to be very competitive with larger, more complex, more difficult to specify, and more costly to maintain structural models, often delivering more accurate forecasts. These models are described more completely on the Forecast Addendum page, linked below.
The current forecasting model should be viewed as the first iteration in an ongoing process. Well-specified statistical models can predict accurately when the future is similar to the past. Of course, structural changes can make the future different from the past, and the quality of statistical model forecasts will deteriorate unless the model is adjusted to account for these changes. Consequently, it is necessary to revisit the specifications periodically as more data become available.
The forecasts we present are purely statistical and don’t reflect any subjective adjustments, which are left to the discretion of the forecast user. We provide the best estimate of the variable in each of the four quarters of the forecast (the red line in graphs of the forecast) and a forecast cone (the grey area) that reflects the relative accuracy of past forecasts for that variable at each forecast horizon. The cone “fans” out because the farther ahead we forecast, the less accurate the forecast, a well-known characteristic of economic forecasts.
In 2023, the Office of Management and Budget redefined the Metropolitan Statistical Areas (MSAs) of the U.S. MSAs are defined as territory containing one or more urban areas with at least 50,000 population and the area around the(se) urban area(s) that is(are) highly integrated both economically and socially with the urban area(s). The degree of integration is measured by commuting ties. The most recent release of employment data by the Bureau of Labor Statistics reflects the new MSA definitions.
Louisiana has a new MSA (Slidell-Mandeville-Covington), and some others like, for example, New Orleans-Metairie have been redefined. Consequently, the forecasting models for the old MSAs have been re-specified, and a forecasting model has been generated for the new MSA. The table below provides information on the territory included in each MSA.
Current Louisiana MSAs
| MSA | Principal Urban Area(s) | Parishes |
|---|---|---|
| Alexandria | Alexandria | Grant, Rapides |
| Baton Rouge | Baton Rouge | Ascension, Assumption, East Baton Rouge, East Feliciana, Iberville, Livingston, Pointe Coupee, St. Helena, West Baton Rouge, West Feliciana |
| Hammond | Hammond | Tangipahoa |
| Houma-Bayou Cane-Thibodaux | Houma, Bayou Cane, Thibodaux | Lafourche, Terrebonne |
| Lafayette | Lafayette | Acadia, Lafayette, St. Martin, Vermillion |
| Lake Charles | Lake Charles | Calcasieu, Cameron, Jefferson Davis |
| Monroe | Monroe | Morehouse, Ouachita, Richland, Union |
| New Orleans-Metairie | New Orleans, Metairie | Jefferson, Orleans, Plaquemines, St. Bernard, St. Charles, St. James, St. John the Baptist |
| Shreveport-Bossier City | Shreveport, Bossier City | Bossier, Caddo, DeSoto |
| Slidell-Mandeville-Covington | Slidell, Mandeville, Covington | St. Tammany |
Changes from previous MSA definitions:
- Houma-Thibodaux renamed Houma-Bayou Cane-Thibodaux. No changes in the parishes included in this MSA.
- Lafayette: Iberia Parish removed from this MSA and is no longer a part of any MSA.
- Lake Charles: Jefferson Davis Parish added to this MSA.
- Monroe: Richland Parish added to this MSA.
- New Orleans-Metairie: St. Tammany Parish removed from this MSA and now constitutes the Slidell-Mandeville-Covington MSA.
- Slidell-Mandeville-Covington: new MSA associated with St. Tammany Parish.
For perspective about the Louisiana economy, it is instructive to compare employment, population, real GSP, real GSP per capita, and real GSP per worker in Louisiana to that in other states. Open the PDF addendum linked below to view an in-depth comparison.
The quarterly forecasts of Louisiana employment are for total non-farm employment. This total includes both private sector and government sector employment. To better understand employment trends in Louisiana, the PDF addendum linked below provides historical information on the breakdown of total employment between private sector and government employment and then for specific sectors within the government and private sectors.
More Economics Research from LSU
Questions? Contact Us.
LSU Department of Economics
2300 Business Education Complex
501 South Quad Dr.
Baton Rouge, LA 70803
225-578-5211 | econ@lsu.edu